OCI collects and analyzes capacity, performance, and service path metrics in near real time over IP, and without
the use of agents. Below explanation walks you through a typical performance
troubleshooting exercise in a multi-vendor, multi-platform environment. You can quickly identify the contending
resources and bottlenecks within the demonstration by using OCI. In addition, we can analyze an end-to-end service path violation triggered by OnCommand Insight’s
configurable alert-based policies.
A basic OnCommand Insight deployment consists of two servers (Virtual or Physical). One Windows server is designated for the OnCommand Insight Java Operational Client and WebUI, and a separate Windows server is designated for the OnCommand Insight WebUI Data Warehouse for long term reporting. The Java operational Client and WebUI contains the last 7 days of capacity, performance and service quality information. Data from the OnCommand Insight Operational Client is sent daily to the centralized reporting Data Warehouse (DWH) for historical, trending, and forecast reporting needs. In very large geographically dispersed or firewalled data center environments, multiple operational clients can be deployed, and consolidation of enterprise data is possible within a single data warehouse.
=>OCI Dashboard will give the full storage environment details.
Analyzing a LUN latency issue:
In below explanation, an alert is generated from OnCommand Insight indicating VM or LUN latency is over the acceptable policy levels, or the associated application owner complains of poor VM or LUN responsiveness.
Example Trobleshooting:
VM - vm_exchange_1
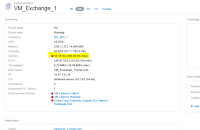
=>On the “Virtual Machine” page, reviewing the summary pane reveals there is an indicated latency violation of “50.01 ms” within the last 24 hours, with a peak, or top, latency of “450 ms”.
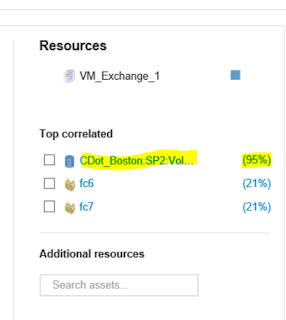
=>Under the “Top Correlated Resources” ranking view, we can see there is a Volume/Lun that is reported as “95%” correlated.
=>By selecting the percentage ranking indicator we can see that OCI analytics report a 95% correlation to latency.
The latency experienced by VM_Exchange is 95% correlated to the latency on the volume (CDOT_Boston:SP2:VOL_01\Lun01).
=>Select the volume checkbox (CDOT_Boston:SP2:VOL_01\Lun01). We can see that there is a direct pattern in latency between CDOT_Boston:SP2:VOL_01\Lun01 and the impacted VM_Exchange_1 server.
The red dot indicates where performance policy has been violated.
=>Now double click the volume (CDOT_Boston:SP2:VOL_01\Lun01 ),
=>Vm_Exchange_1 Server, and a new storage node “(CDOT_Boston_N1)” are identified as having a 91% correlation ranking. Selecting the checkbox OCI indicates that increase in IOPs and Utilization. Notice the last 24 hours utilization is displayed steadily trending upwards on the utilization graph.
Bullies:
Select the Bullies checkbox next to (CDot_Boston:SP1:Vol_\LUN01) adding the volume data to the expert timeline. OCI’s advanced correlation analytics identifies “Bullies”, as shared resources that are highly correlated resources that impact latency, IOPS or Utilization. Also we can easily view the increase of volume (Lun) IOPs corresponding to the increase in latency.
=>Select the 96% correlation ranking for the Bully volume identified in the correlation view. Below information gives an analysis that OCI has identified the high IOPS of one volume to be highly correlated to the increase in latency on a different volume in a shared storage environment.
For example, two volumes sharing the same storage pool where the activity of one volume negatively impacts a different volume that competes for those same storage resources.
=>Now we have identified the Bully resource, investigate further and determine what is driving the Volume IOPs.
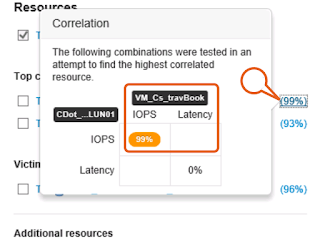
Click the CDot_Boston:SP1:Vol_01\LUN01 bullies, New Virtual Machine has now been identified “(VM_Cs_travBook)”. Select the 99% correlation ranking to view.
The correlation analysis details a 99% correlation between the IOPS driven by the “(VM_Cs_travBook)” VM, and the high IOPS witnessed on the attached volume “(CDot_Boston:SP1:Vol_01\LUN01)”.
=>Select the checkbox for the VM_Cs_travBook VM,
Now we can determine the correlation IOPS of the (VM_Cs_travBook) VM, and the IOPS of the associated volume.
Victims:
Select the Victims volume checkbox for (CDOT_Boston:SP2:VOL_01\Lun01).
=>See the direct correlation in latency for the victim volume (CDOT_Boston:SP2:VOL_01\Lun01), and the higher amount of IOPs generated by the (CDOT_Boston:SP1:VOL_01\Lun01) volume. We can also see both the (VM_Cs_travBook) VM, and the bully volume (CDOT_Boston:SP1:VOL_01\Lun01) are not observing an increase in latency at the specified time, but their activity is impacting the other volume (CDOT_Boston:SP2:VOL_01\Lun01) using the shared storage Storage pool.
=>Now try to determine the reason for the activity. Double click the VM_Cs_travBook VM.
=>And select the 7days data filter and check the IOPS and Latency,
=>Also we can check the remaining performance counter's .. Throughput, memory, CPU.
From the above details provided in CPU, Throughput and Memory graphs, now we have actionable information regarding the VMs performance, and can investigate the cause of the VM’s memory and CPU spike increases.


