Monday, 11 July 2016

OnCommand Insight - OCI

           OCI collects and analyzes capacity, performance, and service path metrics in near real time over IP, and without the use of agents. Below explanation walks you through a typical performance troubleshooting exercise in a multi-vendor, multi-platform environment. You can quickly identify the contending resources and bottlenecks within the demonstration by using OCI. In addition, we can analyze an end-to-end service path violation triggered by OnCommand Insight’s configurable alert-based policies.

            A basic OnCommand Insight deployment consists of two servers (Virtual or Physical). One Windows server is designated for the OnCommand Insight Java Operational Client and WebUI, and a separate Windows server is designated for the OnCommand Insight WebUI Data Warehouse for long term reporting. The Java operational Client and WebUI contains the last 7 days of capacity, performance and service quality information. Data from the OnCommand Insight Operational Client is sent daily to the centralized reporting Data Warehouse (DWH) for historical, trending, and forecast reporting needs. In very large geographically dispersed or firewalled data center environments, multiple operational clients can be deployed, and consolidation of enterprise data is possible within a single data warehouse.


=>OCI Dashboard will give the full storage environment details.

Analyzing a LUN latency issue:

In below explanation, an alert is generated from OnCommand Insight indicating VM or LUN latency is over the acceptable policy levels, or the associated application owner complains of poor VM or LUN responsiveness.

Example Trobleshooting:

VM - vm_exchange_1

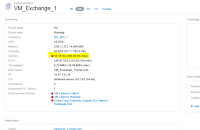
=>On the “Virtual Machine” page, reviewing the summary pane reveals there is an indicated latency violation of “50.01 ms” within the last 24 hours, with a peak, or top, latency of “450 ms”.

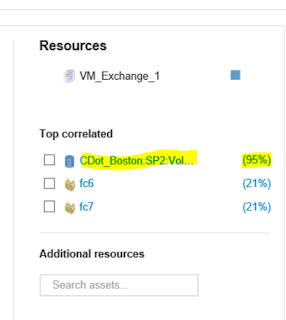
=>Under the “Top Correlated Resources” ranking view, we can see there is a Volume/Lun that is reported as “95%” correlated.


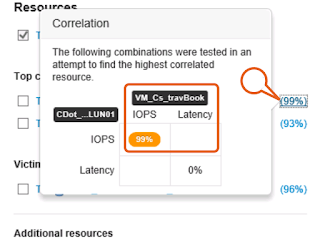
=>By selecting the percentage ranking indicator we can see that OCI analytics report a 95% correlation to latency.

The latency experienced by VM_Exchange is 95% correlated to the latency on the volume (CDOT_Boston:SP2:VOL_01\Lun01).


=>Select the volume checkbox (CDOT_Boston:SP2:VOL_01\Lun01). We can see that there is a direct pattern in latency between CDOT_Boston:SP2:VOL_01\Lun01 and the impacted VM_Exchange_1 server.
The red dot indicates where performance policy has been violated.

=>Now double click the volume (CDOT_Boston:SP2:VOL_01\Lun01 ),


=>Vm_Exchange_1 Server, and a new storage node “(CDOT_Boston_N1)” are identified as having a 91% correlation ranking. Selecting the checkbox OCI indicates that increase in IOPs and Utilization. Notice the last 24 hours utilization is displayed steadily trending upwards on the utilization graph.

Bullies:
Select the Bullies checkbox next to (CDot_Boston:SP1:Vol_\LUN01) adding the volume data to the expert timeline. OCI’s advanced correlation analytics identifies “Bullies”, as shared resources that are highly correlated resources that impact latency, IOPS or Utilization. Also we can easily view the increase of volume (Lun) IOPs corresponding to the increase in latency.

=>Select the 96% correlation ranking for the Bully volume identified in the correlation view. Below information gives an analysis that OCI has identified the high IOPS of one volume to be highly correlated to the increase in latency on a different volume in a shared storage environment.
For example, two volumes sharing the same storage pool where the activity of one volume negatively impacts a different volume that competes for those same storage resources.
=>Now we have identified the Bully resource, investigate further and determine what is driving the Volume IOPs.

Click the CDot_Boston:SP1:Vol_01\LUN01 bullies, New Virtual Machine has now been identified “(VM_Cs_travBook)”. Select the 99% correlation ranking to view.

The correlation analysis details a 99% correlation between the IOPS driven by the “(VM_Cs_travBook)” VM, and the high IOPS witnessed on the attached volume “(CDot_Boston:SP1:Vol_01\LUN01)”.


=>Select the checkbox for the VM_Cs_travBook VM,
Now we can determine the correlation IOPS of the (VM_Cs_travBook) VM, and the IOPS of the associated volume.

Victims:
Select the Victims volume checkbox for (CDOT_Boston:SP2:VOL_01\Lun01).

=>See the direct correlation in latency for the victim volume (CDOT_Boston:SP2:VOL_01\Lun01), and the higher amount of IOPs generated by the (CDOT_Boston:SP1:VOL_01\Lun01) volume. We can also see both the (VM_Cs_travBook) VM, and the bully volume (CDOT_Boston:SP1:VOL_01\Lun01) are not observing an increase in latency at the specified time, but their activity is impacting the other volume (CDOT_Boston:SP2:VOL_01\Lun01) using the shared storage Storage pool.

=>Now try to determine the reason for the activity. Double click the VM_Cs_travBook VM.

=>And select the 7days data filter and check the IOPS and Latency,

=>Also we can check the remaining performance counter's .. Throughput, memory, CPU.

From the above details provided in CPU, Throughput and Memory graphs, now we have actionable information regarding the VMs performance, and can investigate the cause of the VM’s memory and CPU spike increases.




Wednesday, 11 May 2016

Aggregate Relocation

            Aggregate relocation operations take advantage of the HA configuration to move the ownership of storage aggregates within the HA pair. Aggregate relocation occurs automatically during manually initiated takeover to reduce downtime during planned failover events such as nondisruptive software upgrade, and can be initiated manually for load balancing, maintenance, and nondisruptive controller upgrade. Aggregate relocation cannot move ownership of the root aggregate. (Source: Netapp site)


The aggregate relocation operation can relocate the ownership of one or more SFO aggregates if the destination node can support the number of volumes in the aggregates. There is only a short interruption of access to each aggregate. Ownership information is changed one by one for the aggregates.
During takeover, aggregate relocation happens automatically when the takeover is initiated manually. Before the target controller is taken over, ownership of the aggregates belonging to that controller are moved one at a time to the partner controller. When giveback is initiated, the ownership is automatically moved back to the original node. The ‑bypass‑optimization parameter can be used with the storage failover takeover command to suppress aggregate relocation during the takeover.
Command Options:
ParameterMeaning
-node nodenameSpecifies the name of the node that currently owns the aggregate.
-destination nodenameSpecifies the destination node where aggregates are to be relocated.
-aggregate-list aggregate nameSpecifies the list of aggregate names to be relocated from source node to destination node. This parameter accepts wildcards.
-override-vetoes true|falseSpecifies whether to override any veto checks during the relocation operation.
-relocate-to-higher-version true|falseSpecifies whether the aggregates are to be relocated to a node that is running a higher version of Data ONTAP than the source node.
-override-destination-checks true|falseSpecifies if the aggregate relocation operation should override the check performed on the destination node.
CLI:
Aggregate name - HLTHFXDB1
Node1 name - cluster1-01
Node2 name - cluster1-02
Now create aggregate on node2, then relocate to node1 from node2,
Create a aggregate HLTHFXDB1 on node cluster1-02,

Check the newly created aggregate using aggr show command,

Now relocate the aggregate from node 2 to node 1,


Now HLTHFXDB1 relocation is done, check the status using aggr show command,


That's it :)

Wednesday, 4 May 2016

LIF Migration

    LIF migration is the ability to dynamically move logical interfaces from one physical port to another in a cluster, allowing you to migrate them to higher performing network ports or take nodes offline for maintenance while preserving data access. SAN LIFs do not support migrate in normal operation, as iSCSI and Fibre Channel instead use multipathing and ALUA to protect against network path failure. LIF migration is non-disruptive for NFS and for newer SMB protocol versions.

Step1: cluster1 Configuration Network -> select network interfaces

LIF1 - svm1_cifs_nfs_lif1 (cluster1-01 node, port e0c)
LIF2 - svm1_cifs_nfs_lif2 (cluster1-02 node, port e0c)

Now we are going to migrate lif "svm1_cifs_nfs_lif1 to cluster1-02,port e0d"


Svm1 uses DNS load balancing for it’s NAS LIFs, so we cannot predict in advance which of those two LIFs the host running,so in CLI we can determine which LIF is handling that traffic using lif statistics command,


Step 2: In the “Network” pane of System Manager, locate in the interface list the LIF which we want to migrate and note the current port assignment.


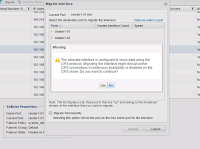
select the migrate option,


Select the destination node port, here it would be cluster1-02, port e0d


notice the Migrate Permanently check box in this window. If you check this box it indicates that the LIF’s home port should also be set to this new port value.


 Migration is completed. Now we can check in the system manager, network interface tab,


The “Current Port” value shown for the LIF in the Network Interfaces list has changed to reflect the nodes’ new port assignment. The small red X next to the current port entry indicates that the LIF does not currently reside on it’s configured home port.

now send the LIF back to it’s home port,


The LIF migrates back to it’s home port, once again without disrupting IO's.


The “Current Port” value for the LIF returns to it’s original value in the Network Interfaces list, and the red X disappears to indicate that the LIF is back on it’s home port.

LIF Migration in CLI:

Step:1 Using the migrate command, migrate the LIF1 to cluster1-02, port e0d,


LIf1 is migrated to cluster1-02, port e0d,


Now revert back to it's home port using revert command,


Now LIF1 is back to it's home port.

That's it :)

Friday, 24 July 2015

Snapmirror Concept

The Basics:

      When mirroring asynchronously, SnapMirror replicates Snapshot copy images from a source volume or qtree to a partner destination volume or qtree, thus replicating source object data to destination objects at regular intervals. SnapMirror source volumes and qtrees are writable data objects whose data is to be replicated. The source volumes and qtrees are the objects that are normally visible, accessible, and writable by the storage system’s clients.

The SnapMirror destination volumes and qtrees are read-only objects, usually on a separate storage system, to which the source volumes and qtrees are replicated. Customers might want to use these read-only objects for auditing purposes before the objects are converted to writable objects. In addition, the read-only objects can be used for data verification. The more obvious use for the destination volumes and qtrees is to use them as true replicas for recovery from a disaster. In this case, a disaster takes down the source volumes or qtrees and the administrator uses SnapMirror commands to make the replicated data at the destination accessible and writable.

SnapMirror uses information in control files to maintain relationships and schedules. One of these control files, the snapmirror.conf file, located on the destination system, allows scheduling to be maintained. This file, along with information entered by using the snapmirror.access option or the snapmirror.allow file is used to establish a relationship between a specified source volume, or qtree for replication, and the destination volume, or qtree where the mirror is kept.

Snapshot Copy Behavior in SnapMirror:

SnapMirror uses a Snapshot copy as a marker for a point in time for the replication process. A copy is kept on the source volume as the current point in time that both mirrors are in sync. When an update occurs, a new Snapshot copy is created and is compared against the previous Snapshot copy to determine the changes since the last update. SnapMirror marks the copies it needs to keep for a particular destination mirror in such a way that the snap list command displays the keyword snapmirror next to the necessary Snapshot copies.

The snapmirror destinations command can be used to see which replica of a particular copy is marked as required at any time. On the source volume, SnapMirror creates the Snapshot copy for a particular destination and immediately marks it for that destination. At this point, both the previous copy and the new copy are marked for this destination. After a transfer is successfully completed, the mark for
the previous copy is removed and deleted. Snapshot copies left for cascade mirrors from the destination also have the snapmirror tag in the snap list command output.

Use the snapmirror destinations -s command to find out why a particular Snapshot copy is marked. This mark is kept as a reminder for SnapMirror to not delete a copy. This mark does not stop a user from deleting a copy marked for a destination that will no longer be a mirror; use the snapmirror release command to force a source to forget about a particular destination. This is a safe way to have SnapMirror remove its marks and clean up Snapshot copies that are no longer needed. Deleting a Snapshot copy that is marked as needed by SnapMirror is not advisable and must be done with caution in order not to disallow a mirror from updating. While a transfer is in progress, SnapMirror uses the busy lock on a Snapshot copy. This can be seen in the snap list command output. These locks do prevent users from deleting the Snapshot copy. The busy locks are removed when the transfer is complete.

For volume replication, SnapMirror creates a Snapshot copy of the whole source volume that is copied to the destination volume. For qtree replication, SnapMirror creates Snapshot copies of one or more source volumes that contain qtrees identified for replication. This data is copied to a qtree on the destination volume and a Snapshot copy of that destination volume is created.

Snapshot examples:

A volume SnapMirror Snapshot copy name has the following format:

dest_name(sysid)_name.number
Example: fasA(0050409813)_vol1.6 (snapmirror)
dest_name is the host name of the destination storage system.
sysid is the destination system ID number.
name is the name of the destination volume.
number is the number of successful transfers for the Snapshot copy, starting at 1. Data ONTAP increments this number for each transfer.

A qtree SnapMirror Snapshot copy name has the following format:

dest_name(sysid)_name-src|dst.number
Example: fasA(0050409813)_vol1_qtree3-dst.15 (snapmirror)
dest_name is the host name of the destination storage system.
sysid is the destination system ID number.
name is the name of the destination volume or qtree path.
src|dst identifies the Snapshot copy location.
number is an arbitrary start point number for the Snapshot copy. Data ONTAP increments this number for each transfer.
In the output of the snap list command, Snapshot copies needed by SnapMirror are followed by the SnapMirror name in parentheses.
Caution: Deleting Snapshot copies marked snapmirror can cause SnapMirror updates to fail.

Modes of SnapMirror:

SnapMirror can be used in three different modes: SnapMirror Async, SnapMirror Sync, and SnapMirror Semi-Sync.

SnapMirror Async:

SnapMirror Async can operate on both qtrees and volumes. In this mode, SnapMirror performs incremental block-based replication as frequently as once per minute.
The first and most important step in this mode involves the creation of a one-time baseline transfer of the entire dataset. This is required before incremental updates can be performed. This operation proceeds as follows.
1. The source storage system creates a Snapshot copy (a read-only point-in-time image of the file system). This copy is called the baseline copy.
2. All data blocks referenced by this Snapshot copy and any previous copies are transferred in case of volume SnapMirror and written to the destination file system. Qtree SnapMirror only copies the latest Snapshot copy.
3. After the initialization is complete, the source and destination file systems have at least one Snapshot copy in common.

After the initialization is complete, scheduled or manually triggered updates can occur. Each update transfers only the new and changed blocks from the source to the destination file system. This operation proceeds as follows:
1. The source storage system creates a Snapshot copy.
2. The new copy is compared to the baseline copy to determine which blocks have changed.
3. The changed blocks are sent to the destination and written to the file system.
4. After the update is complete, both file systems have the new Snapshot copy, which becomes the baseline copy for the next update.
Because asynchronous replication is periodic, SnapMirror Async is able to consolidate the changed blocks and conserve network bandwidth. There is minimal impact on write throughput and write latency.

SnapMirror Sync:

Certain environments have very strict uptime requirements. All data that is written to one site must be mirrored to a remote site or system synchronously. SnapMirror Sync mode is a mode of replication that sends updates from the source to the destination as they occur, rather than according to a predetermined schedule. This helps enable data written on the source system to be protected on the destination even if the entire source system fails. SnapMirror Semi-Sync mode, which minimizes data loss in a disaster while also minimizing the extent to which replication affects the performance of the source system, is also provided.
No additional license fees need to be paid to use this feature, although a free special license snapmirror_sync must be installed; the only requirements are appropriate hardware, the correct version of Data ONTAP, and a SnapMirror license for each storage system. Unlike SnapMirror Async mode, which can replicate volumes or qtrees, SnapMirror Sync and Semi-Sync modes work only with volumes. SnapMirror Sync can have a significant performance impact and is not necessary or appropriate for all applications.
The first step in synchronous replication is a one-time baseline transfer of the entire dataset. After the baseline transfer is completed, SnapMirror will make the transition into synchronous mode with the help of NVLOG and CP forwarding. Once SnapMirror has made the transition into synchronous mode, the output of a SnapMirror status query shows that the relationship is “In-Sync.”

SnapMirror Semi-Sync:

SnapMirror provides a semi-synchronous mode, also called SnapMirror Semi-Sync. This mode differs from the synchronous mode in two key ways:
1. User writes don’t need to wait for the secondary or destination storage to acknowledge the write before continuing with the transaction. User writes are acknowledged immediately after they are committed to the primary or source system’s memory.
2. NVLOG forwarding is not used in semi-synchronous mode. Therefore SnapMirror Semi-Sync might offer faster application response times. This mode makes a reasonable compromise between performance and RPO for many applications.
Note: Before Data ONTAP 7.3, SnapMirror Semi-Sync was tunable, so that the destination system could be configured to lag behind the source system by a user-defined number of write operations or seconds. This was configurable by specifying a variable called outstanding in the SnapMirror configuration file. Starting in Data ONTAP 7.3, the outstanding parameter functionality is no longer available and there is a new mode called semi-sync. When using semi-sync mode, only the consistency points are synchronized. Therefore this mode is also referred to as CP Sync mode.

Configuration of semi-synchronous mode is very similar to that of synchronous mode; simply replace sync with semi-sync, as in the following example:
fas1:vol1 fas2:vol1 – semi-sync

That's it:)


Saturday, 18 July 2015

NetApp iscsi Lun creation

Step:1

Fisrt create a volume for Lun,
Volume name: sanvol
Size : 25GB.


Step:2

Create a qtree for Lun,


Step:3

Open iscsi initiator on windows and connect to filer.
Click discover portal and give filer IP, port details like following,


Step:4

Successfully connected to filer,


Step:5

Go to configuration tan and copy the initiator name.
While creating the igroup we should provide this IQN number.


Step:6

Go to Filer and check if iscsi is enabled, if not enable the iscsi and start the service,


Step:7

Now create a Lun using "lun create" command,
-s : size of lun
-t : type of operating system


Step:8

Create igroup using "igroup create" command,

igroup create -i -t windows igroupname iqnname
-i : for iscsi need to mention i, for FC need to mention "-f"
-t : Operating system


Step:9

map the Lun to igroup using "lun map" command and give lun id at the end,


Step:10

Check the lun details using lun show -v command,


Step:11

Go to windows client, -> manage -> storage > data ONTAP DSM management.
Here you can see newly created lun and bottom it shows multipath details,


Step:12

Click on Disk management and then initialize, format and give the drive letter like following,


 Click finish to complete the setup,


Now you can see the Disk1 online and healthy,


Here you can see newly created 20GB lun in E:Drive,


That's it :)